


Last spring a call for papers has been announced inviting practitioners, professionals, academics and scholars to submit essays about the function of the arts in redefining the phenomenon of migration, investigating themes such as artistic performance, theatre for development and social change, working practices in multicultural productions, and not only. In its endeavours, Atlas of Transitions seeks to create intercultural meeting spaces for people with diverse cultural backgrounds and to encourage the circulation of ideas across the globe.
'Humanizing Refugee Information Visualizations' is the contribution submitted by Maaria Assami, an information designer living in Boston (USA), always interested in social justice, passionate about designing for advocacy and change.
Full display of 'Humanizing Refugee Information Visualizations'
Humanizing Refugee Information Visualizations
by Maaria Assami
The Syrian conflict is the worst humanitarian crisis of modern history. But, with that reputation, the information visualizations representing this crisis have been accompanied by a voice that tends to be a more inhumane and neutral one. The representations are often done using graphic languages that are used to display statistical and quantitative information. This turns human elements, emotions, and struggles to bar charts and bubble charts, which, in return, dehumanizes their struggles. The two visualizations designed and addressed in this short paper humanize the representation of the Syrian conflict by focusing on individual refugees and individual refugee journeys. Every single one of those millions of Syrian refugees has an experience filled with struggle that they carry along side them on this treacherous journey. By centering on the point of view of one refugee at a time, the visualizations will be more humanized, and, in return, is more impactful than any statistical graph or chart. The Syrian crisis is specifically addressed. Ultimately, however, an awareness for the worldwide refugee crisis will evolve by proxy.
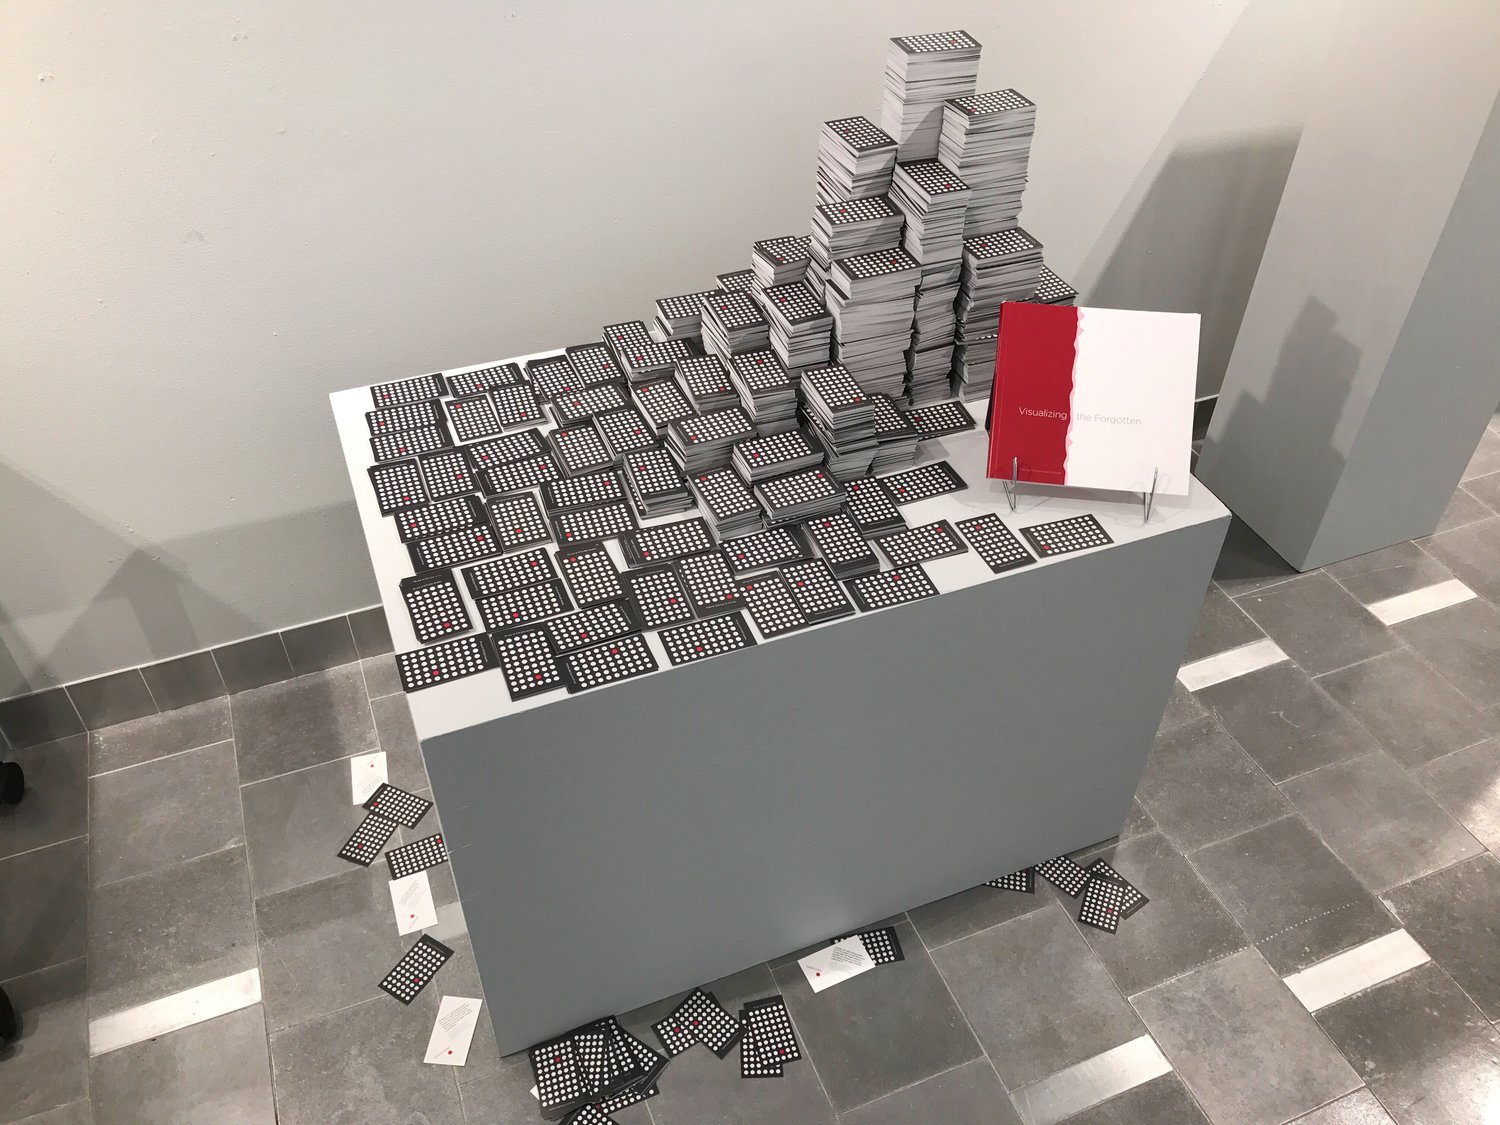
The first visualization comes in the form of a sculpture. It uses cards that are stacked in piles embodying the catastrophic number of Syrian casualties. The pile of almost 10,000 cards holds an accurate number of circles which represents the accurate number of deaths that occurred up until the date of this exhibition. On the first side of each card, there are circles, representing 54 of the 470,000 Syrians who died as a result of the Syrian crisis. However, There is one circle on this side of the card that is highlighted in red without a label. On the opposite side of the card, the red circle stands alone, identifying the name of the Syrian it represents. This side of the card contains a more detailed story of the person’s death told through a paragraph that ends mid–sentence, acting as a metaphor for that their lives ended abruptly. The cards are stacked in piles, inviting viewers to come closer and interact with information about this crisis in a way they are not able to when simply viewing it through a screen. The viewers are encouraged to take a card with them. The more people interact with the pile, the more messy it becomes, which is another aim of the installation–a metaphor for the current messy situation. The pile of cards also acts as a miniature representation of a city within Syria. As time passes and more people get involved and interact with it, the city slowly starts to fade away and crumble–one card at a time.
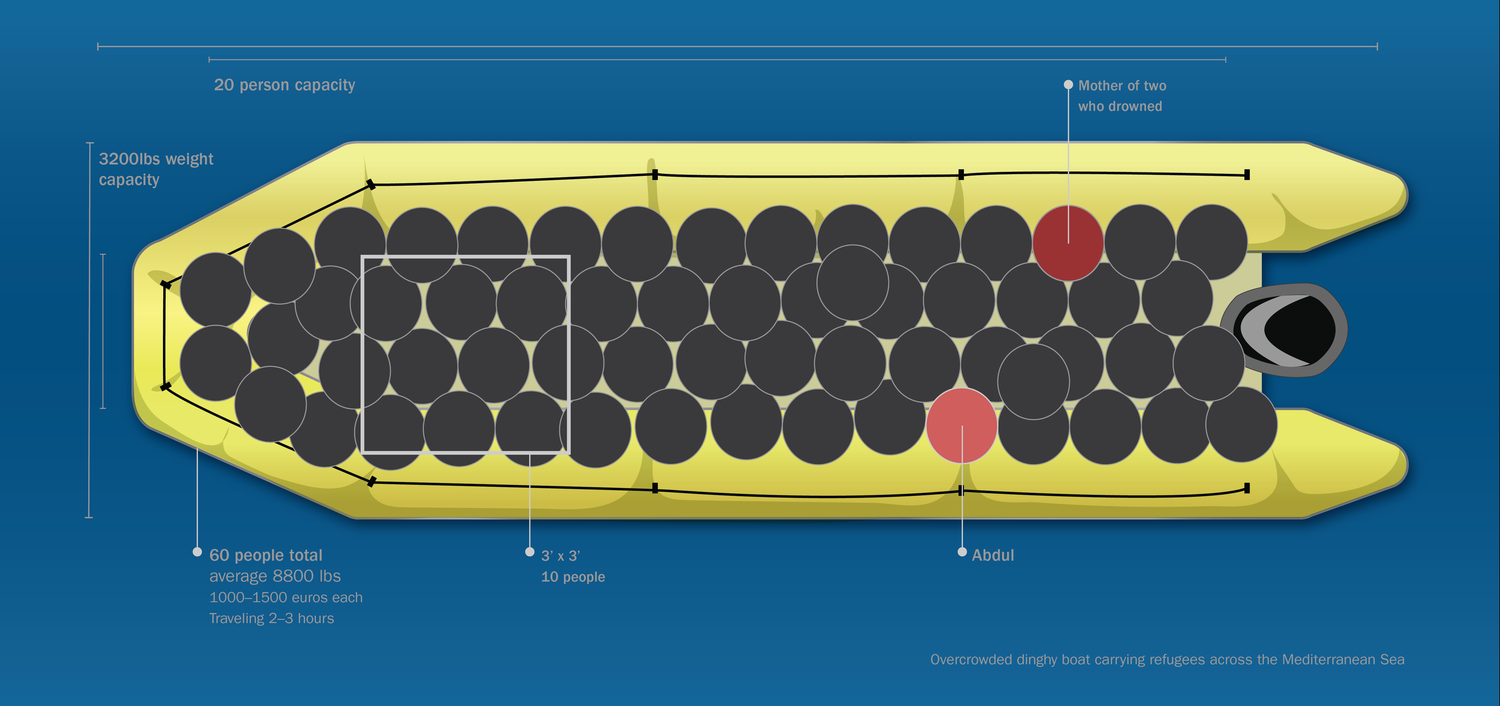
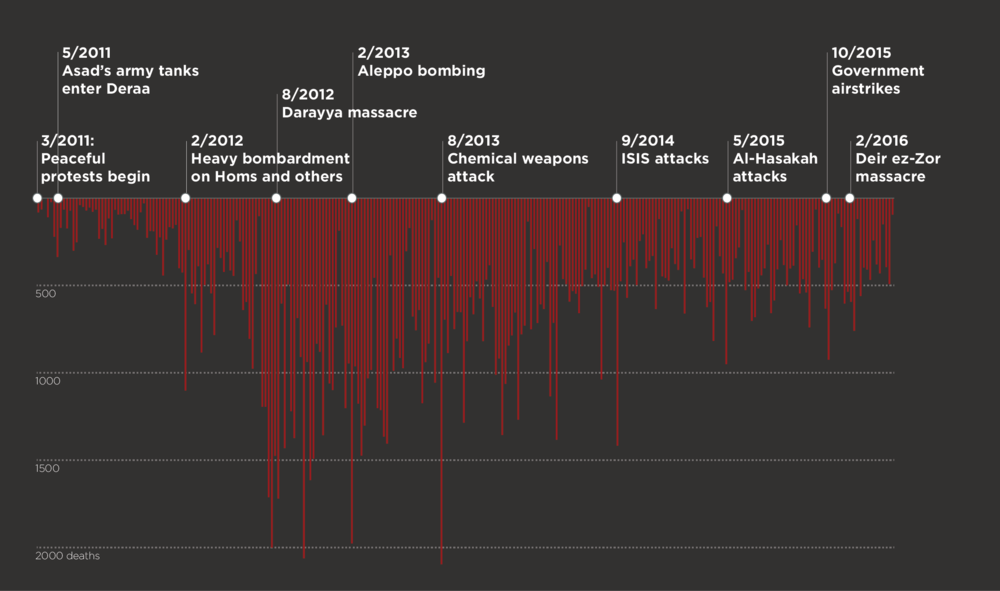
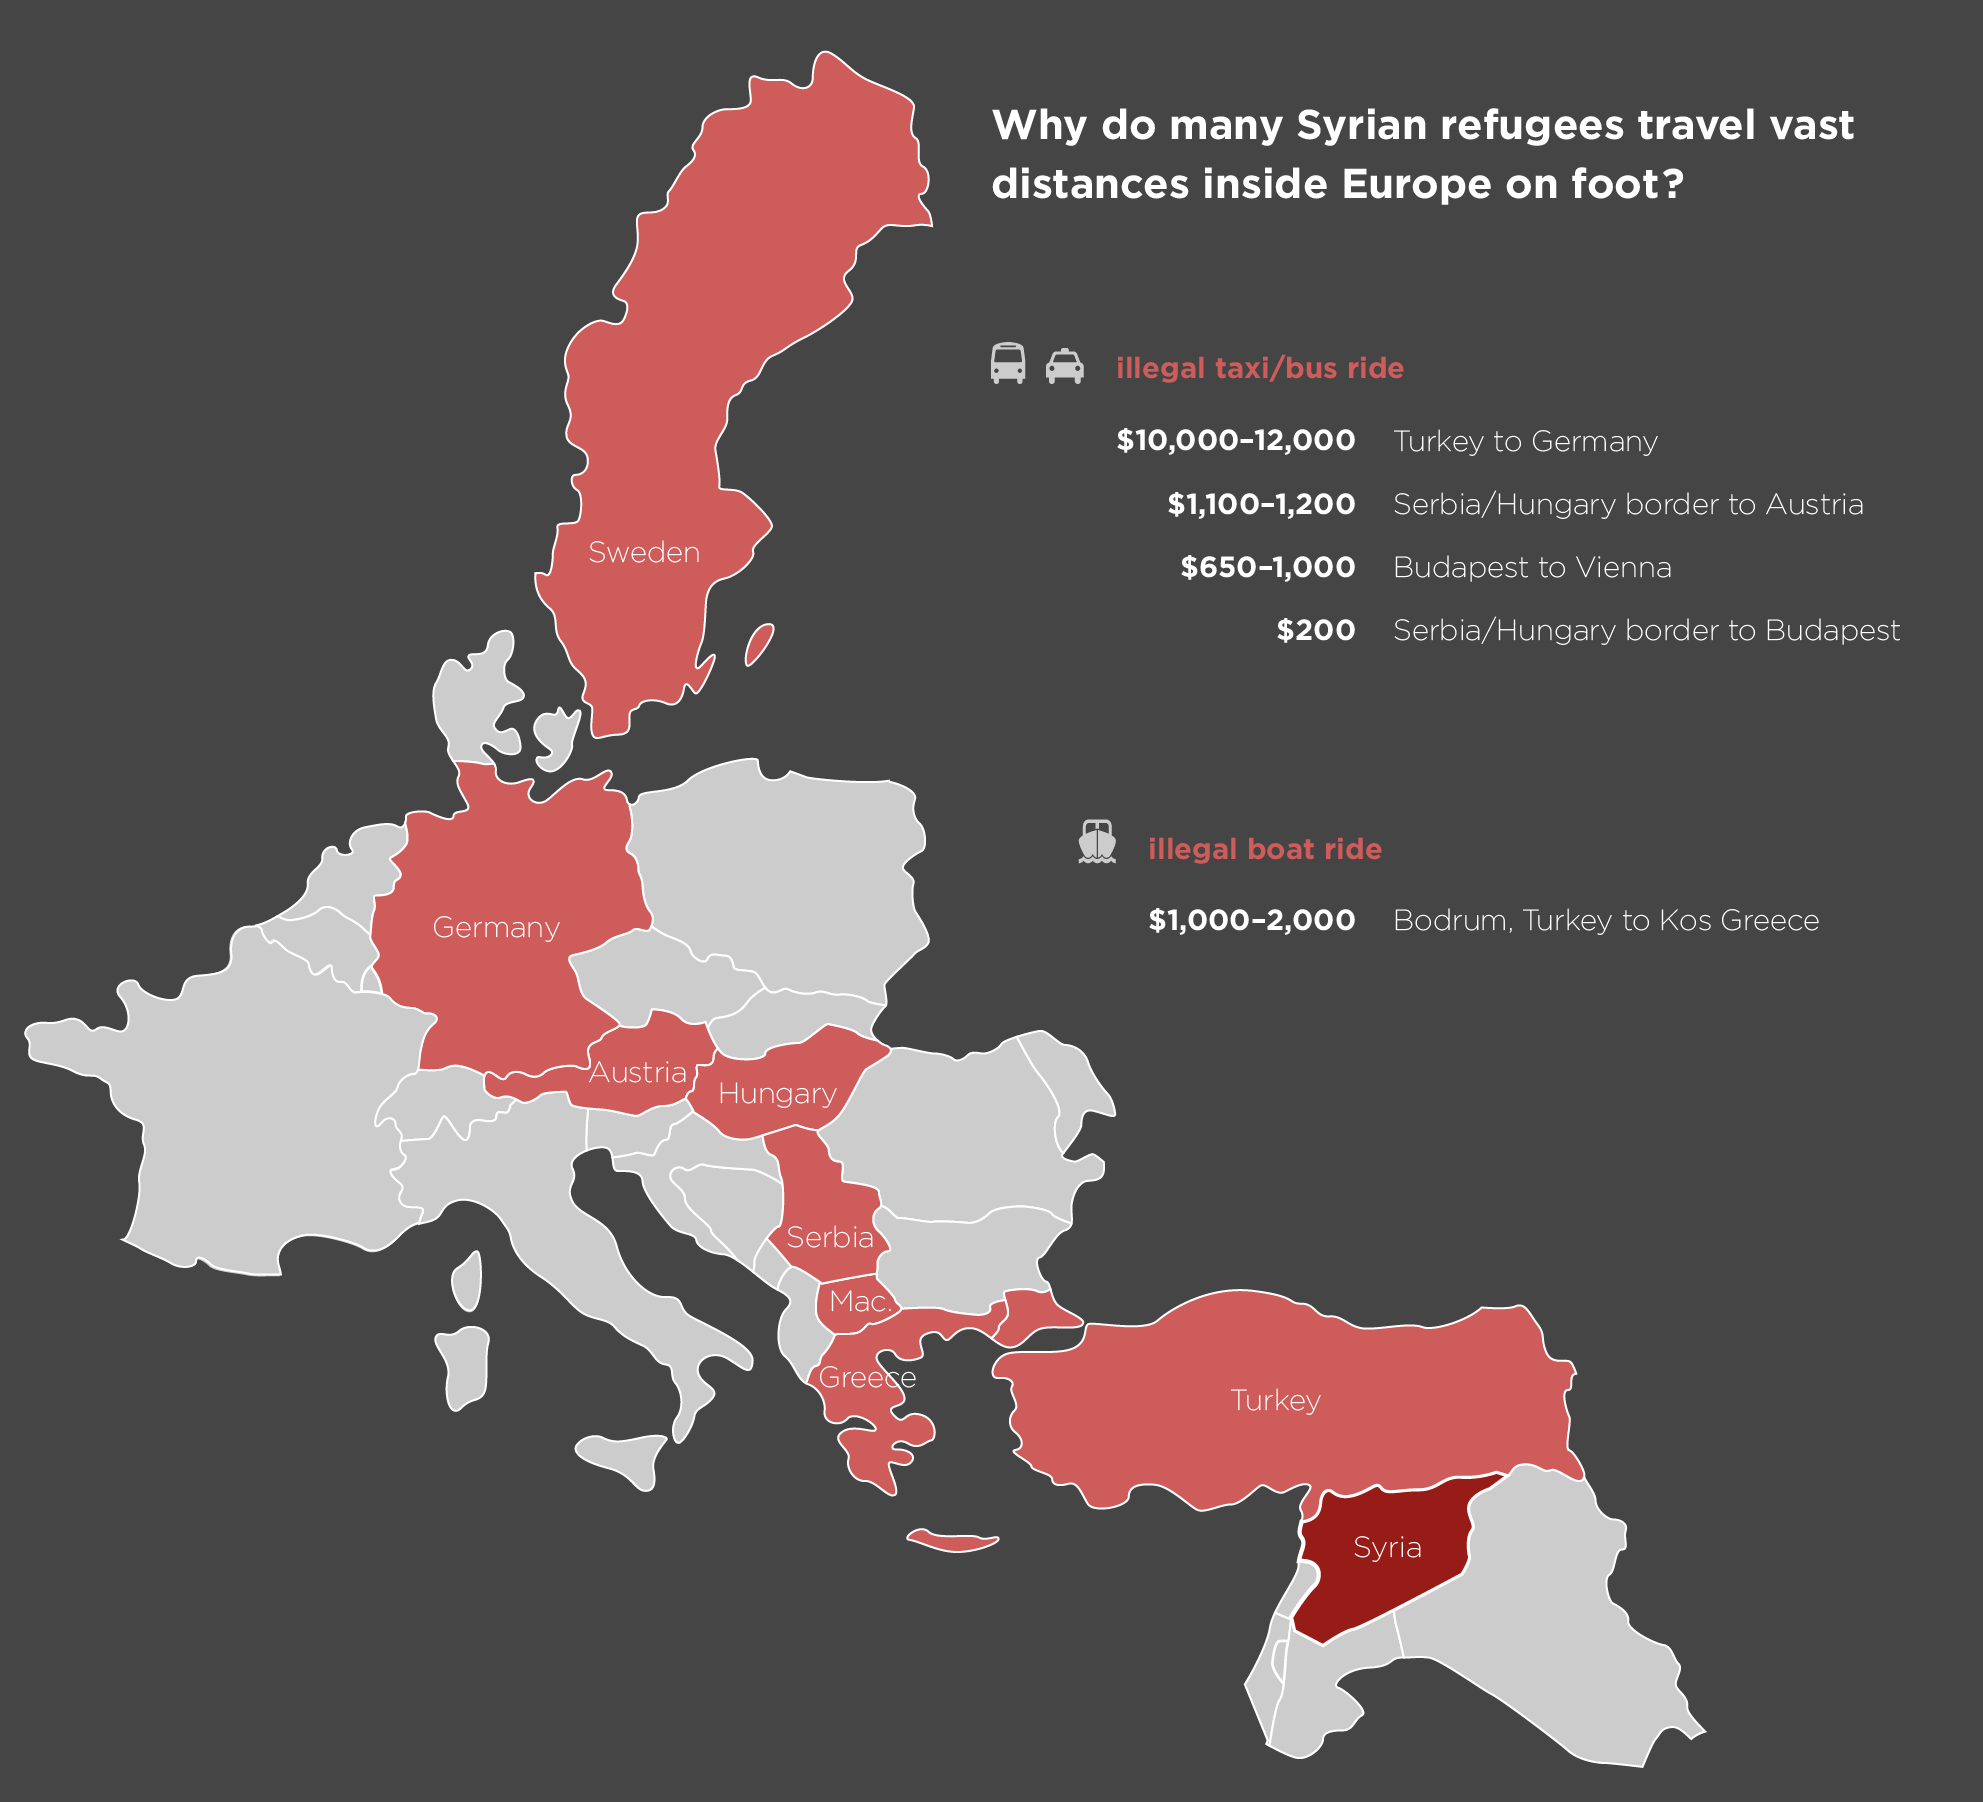
The second visualization, alongside the sculpture, is a book titled 'Visualizing the Forgotten'. In this book, the history of the Syrian crisis is encapsulated since its ignition. The book sheds light on various elements, like historical factors and political events, involved in this crisis. It also contains interactive visualizations that focus on three journeys of three different refugees since the Syrian refugee journey can be made out of three stages: First: The difficulties of being smuggled out of Syrian grounds to any neighboring country. Second: The horror of crossing the Mediterranean Sea on small overloaded dinghy boats from Turkey to Greece. Third And finally: the last leg of the trip, traveling on foot, busses and train from Greece to the final destination in Europe.
Since the overall trip could be divided into three sections, this book is divided into three main chapters as well. Each chapter has information that builds context around the targeted trip to provide deeper understanding of the situation. The chapter also has its own main visualization that will tell a story of one individual refugee, which uses different design techniques as well as employing interactivity through transparency sheets. Since each leg of the trip also has its own various levels of information, and most importantly obstacles and dangers, giving each slice its own focus will start to show the magnitude of the three torturous journeys, and the human cost of the Syrian crisis as a whole.
The three refugees represented in the three main visualizations are real people who really went through and experienced the journeys portrayed. The first two stories are from journalistic sites, and the third story was collected through a personal interview conducted with the aim of not having all stories be personal interviews is to show that humanized visualizations can be achieved from the material and information given at hand. By centering on the point of view of one refugee at a time, the visualizations will be more humanized and more impactful and powerful than any statistical graph or chart.
This two-part design project humanizes the information visualizations by employing individuality, subjectivity, and empathy. This will function as a vehicle to spread awareness about the crisis as a whole, rather than portraying blanket-statement statistics and overall view portrayals, to which we have become numb. Humanizing those visualizations, that represent conflicts where millions of people are feeing from, are of great value and importance, since most of the audiences of the existing visualizations and representations that are emerging reside in Europe, Canada and the United States. These are the main areas that refugees are aiming towards. These visualizations can create a different, more empathetic relation towards the refugees as individuals and can help reframe the issue and be more proactive. It is only natural for the residents, including politicians and security forces, of the host countries to be worried and anxious to receive people who are coming from a war zone, especially if they only read about them and view them as numbers and statistics. When you put faces and names to represent the collective whole, it eases people to acceptance. And acceptance from the residents, in all the parts that they play in that nation, is key to the refugees’ resettlement period.
This project has won the 'Otto Neurath Award for Outstanding Social Relevance.'